Ingredients for the electronic nematic phase in FeSe revealed by its anisotropic optical response
Nematicity is a hallmark in iron-based superconductors and was originally invoked in order to account for the anisotropy in the dc transport properties of the 122-materials Ba(Fe1-xCox)2As2 below the structural tetragonal-to-orthorhombic phase transition. Scenarios for the origin of the anisotropic physical properties, arising from nematicity, primarily range between visions based on the imbalance of the Fermi surface parameters (like effective mass and carrier concentration, incorporated in the plasma frequency) or of the charge carrier scattering rate. The optical response is a suitable tool in this respect, since it gives access to both quantities. Here, we provide data of a thorough optical investigation of FeSe, consisting in the measurement of the optical reflectivity over a broad spectral range and as a function of temperature (T) for samples experiencing a tunable degree of detwinning. We extract the optical conductivity from the far-infrared up to the ultraviolet, thus expanding our initial study mainly limited to the anisotropic electronic excitations. The low energy scales addressed here allow determining the Drude parameters of the transport properties.

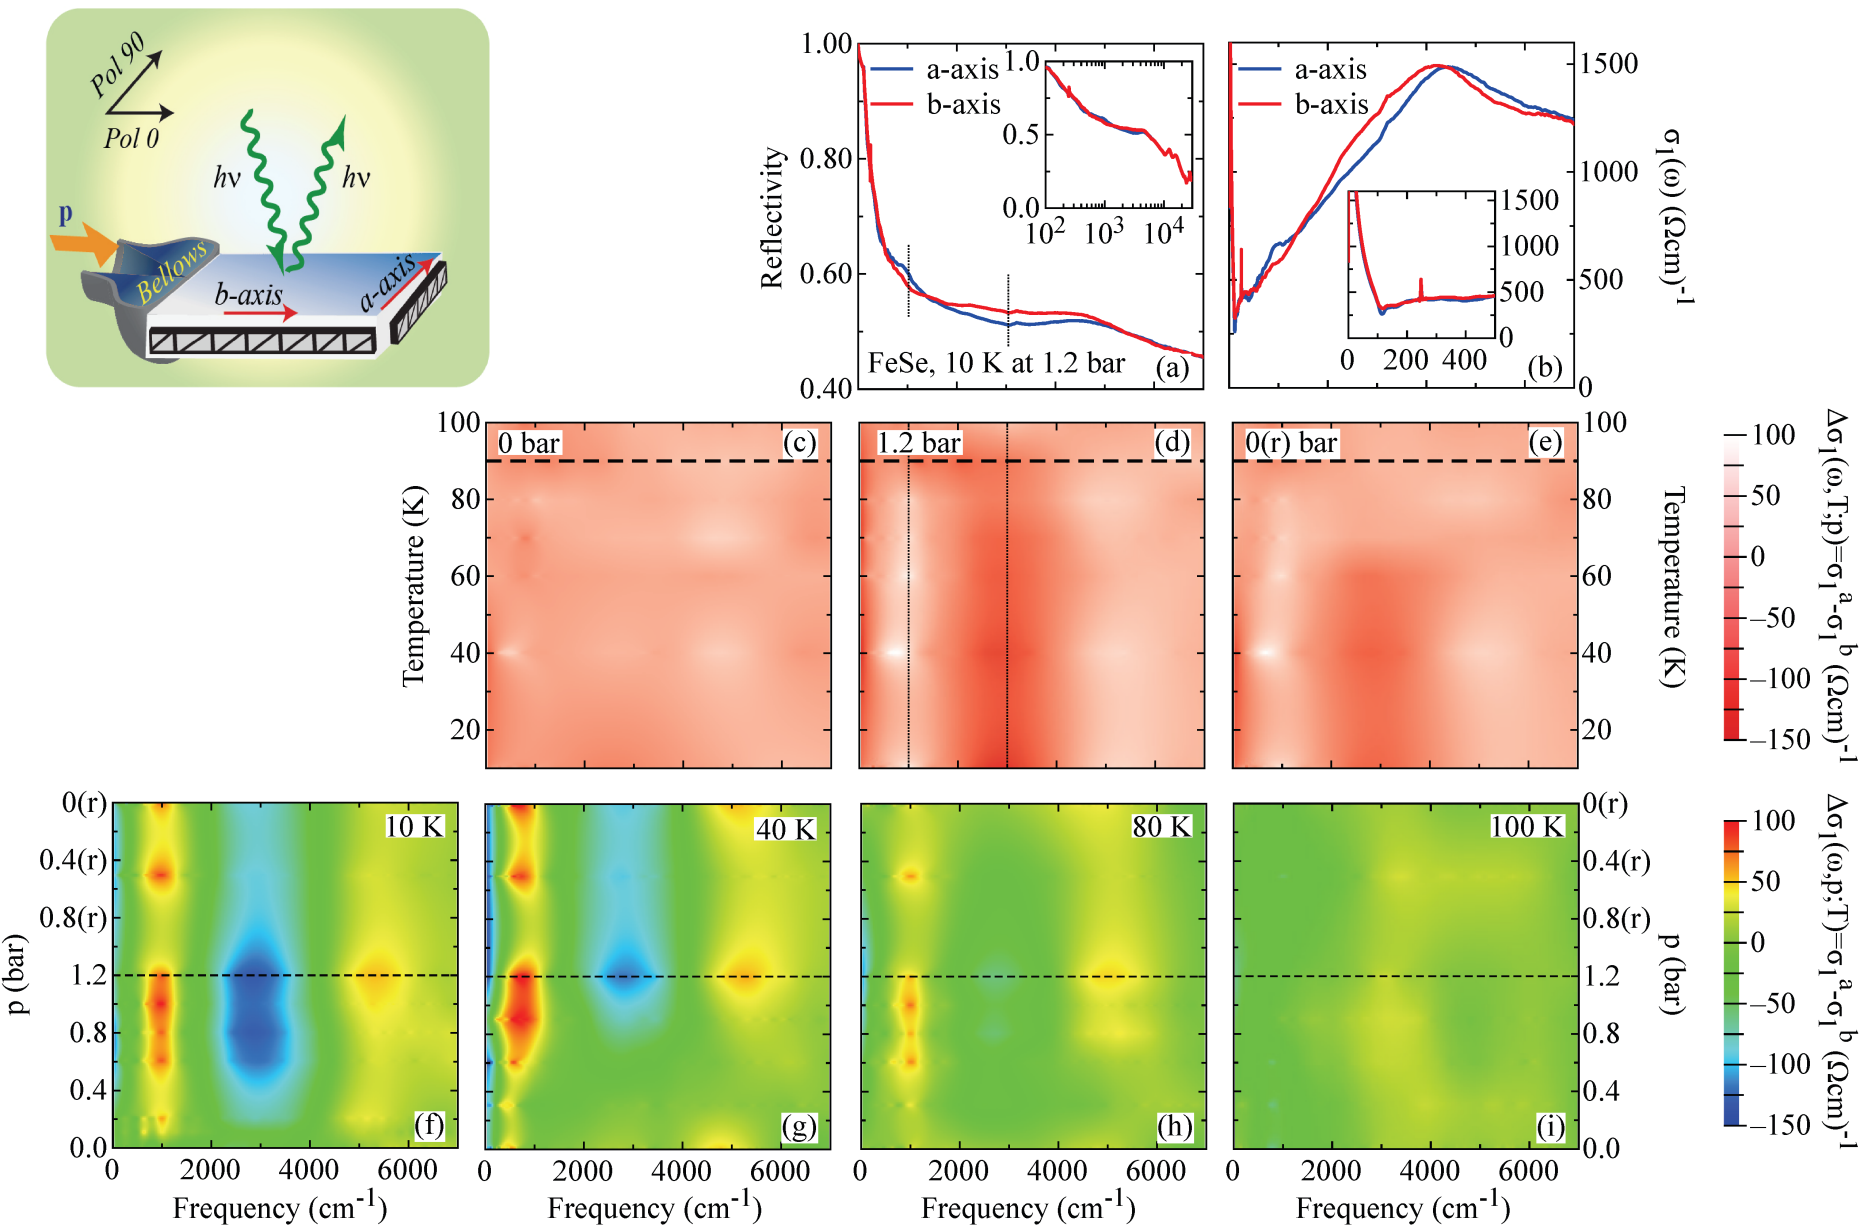
Representative R(ω) data of FeSe in the far- (FIR) and mid-infrared (MIR) spectral range (i.e., for ω < 7000 cm-1) are shown in the main panel of Fig. 2.22(a) at 10 K and with a pressure applied by the spring bellows of pbellows = 1.2 bar, which correspond to the situation for a fully detwinned specimen. The anisotropy of R(ω) between the two polarization directions is clearly visible in the raw data and occurs at FIR-MIR frequencies, within an energy interval of about 0.5 eV, which is fairly consistent with the extent from the Fermi level of the correlated (squeezed) 3d iron bands. The optical anisotropy of R(ω) at FIR-MIR frequencies is also reflected in the excitation spectrum, represented by σ1(ω), as shown at saturation in Fig. 2.22(b). Here, we highlight the T evolution of the so-called dichroism Δσ1(ω) = σ1a(ω) – σ1b(ω) at three selected p of 0, 1.2 and released 0 bar after the p-loop experiment within the ZPC protocol (Fig. 2.22(c)-(e)). The optical anisotropy sets in at Ts and is particularly well identified by the change of sign of Δσ1(ω) around 1000, 3000 and 5000 cm-1 at saturation. Figures 2.22(f)-(i) show Δσ1(ω) at selected T within each p-loop experiments, which emphasise the evolution of the optical anisotropy at T < Ts upon sweeping p. We can recognise the hysteretic behavior of the optical anisotropy, since its saturation value tends to persist at low temperatures, while it vanishes for T → Ts, upon releasing p (see also Fig. 2.22(d)-(e)).

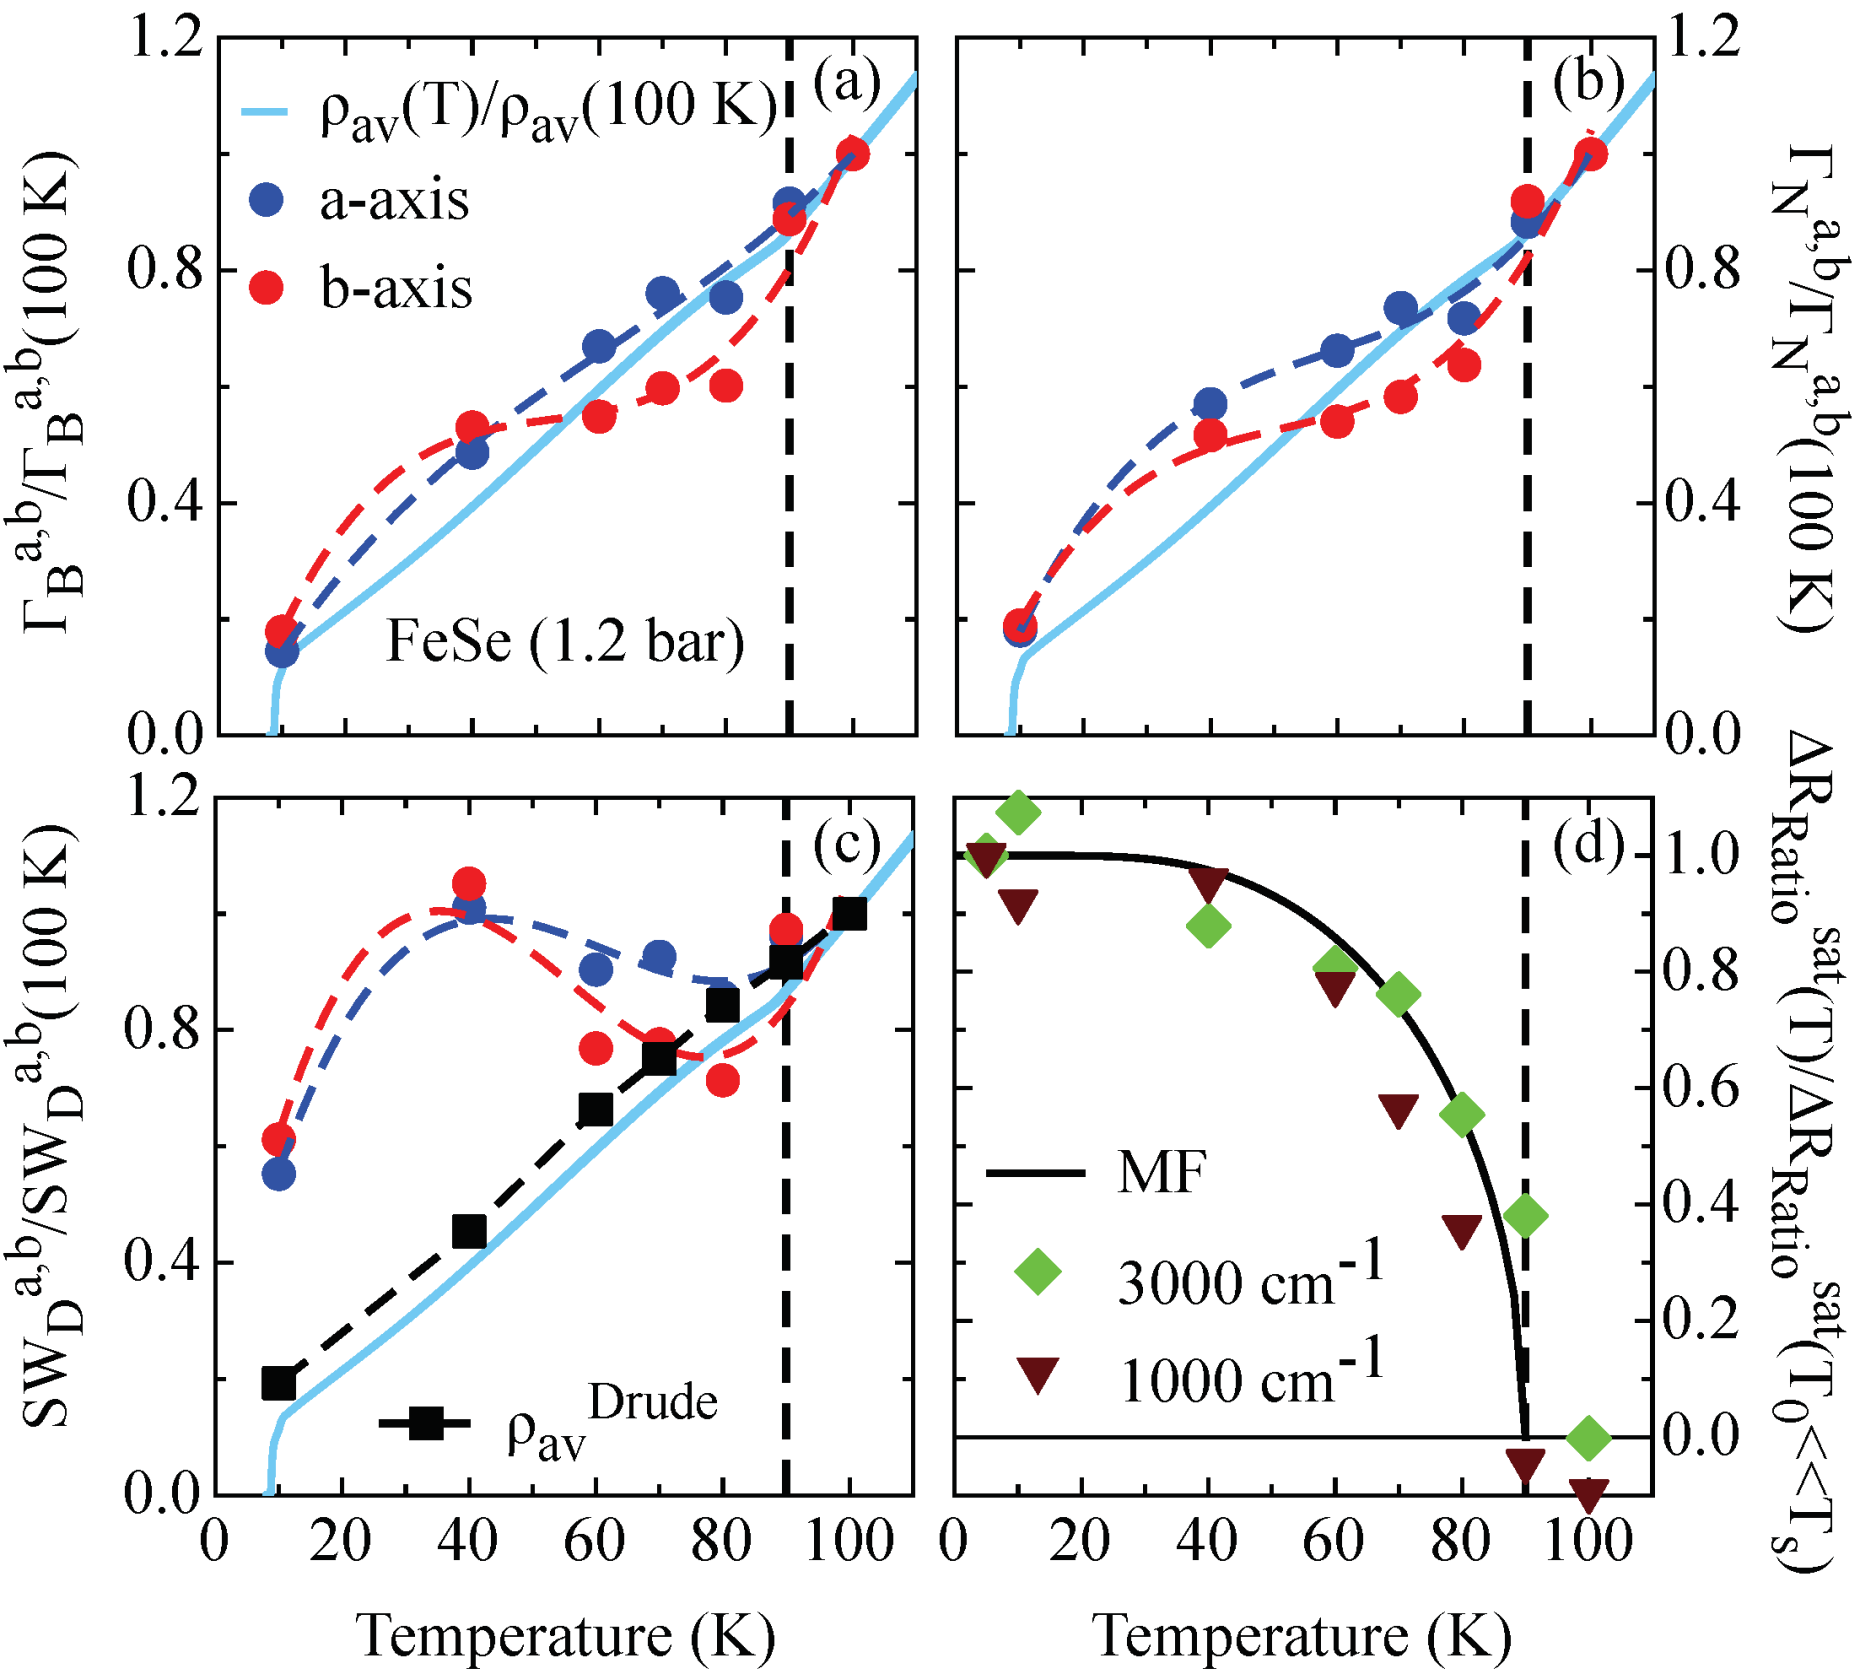
In order to elaborate on possible ingredients for nematicity in FeSe, we first present the results of our analysis from a different perspective in Fig. 2.23, where the T dependence of the anisotropic Drude parameters at saturation is compared to the average dc resistivity. We emphasise again the anisotropy in all Drude quantities, which is mostly evident around 60-70 K, consistent with the anisotropy of the transport dc properties for the strained sample. The comparison reveals that, at variance with early conclusions drawn from our optical results in 122 materials, the Drude weight has a less strong impact on the T dependence of the dc resistivity (Fig. 2.23(c)) than the scattering rates for both narrow and broad Drude terms. In particular, the scattering rates closely follow the dc resistivity as a function of T (Fig. 2.23(a) and (b)). Such a dominant role of our phenomenological Drude scattering rates convincingly supports previous conjectures that inelastic scattering of electrons (e.g., off magnetic fluctuations) would mainly affect the dc transport properties.