Spectral weight reshuffling in the electronic nematic phase of BaFe2As2
It is of interest to elucidate how the spectral weight (SW) is redistributed in σ1(ω) within different spectral ranges and for different combinations of p and T. Figure 2.19 displays the p and T dependence of SW(ωc) along both axes for different ωc, normalized by the corresponding quantity at 160 K, a temperature below which the p-dependent, anisotropic optical response is observed. Indeed, SW for any ωc at T ≥ 160 K is isotropic (Fig. 2.19 (a)) and turns out to be fully p-independent. In the same figure we also display the ratio SWa(ωc)/SWb(ωc) at various ωc, highlighting the p and T evolution of the anisotropy in the SW distribution. We may remark with respect to 160 K a weak enhancement of SW for ωc < 500 cm-1 along the a axis (Fig. 2.19 (b,e)) versus a depletion of SW in the same spectral range along the b axis (Fig. 2.19 (c,f)), when entering the orthorhombic phase.
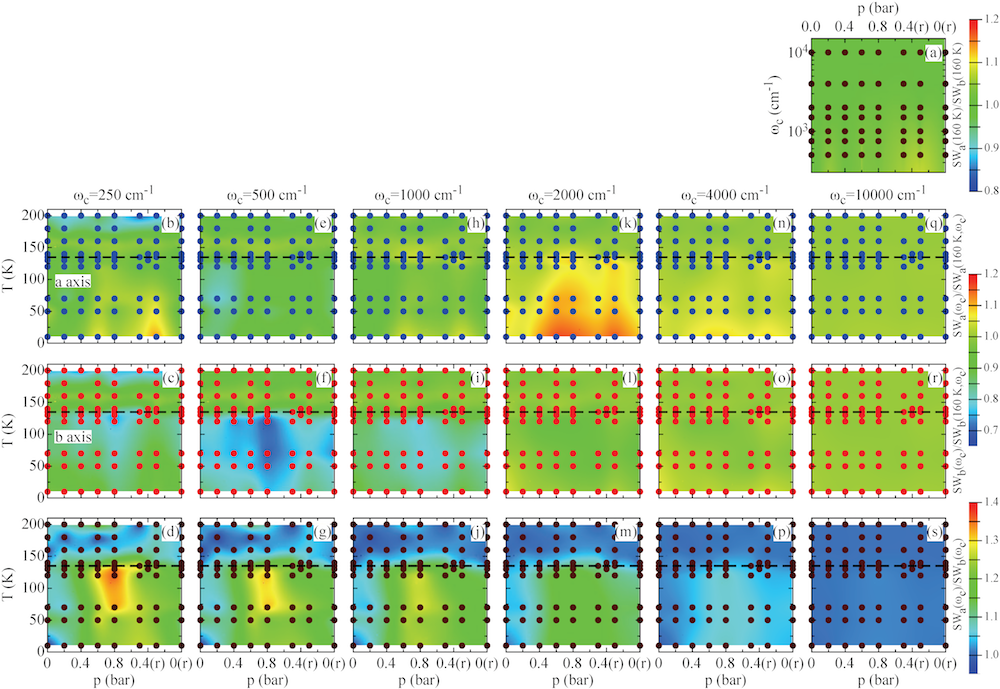
Upon increasing ωc there is a further enhancement of SW along the a axis, which piles up at ωc < 2000 cm-1 for T << Ts,N and p ≥ 0.4 bar (Fig. 2.19 (k)), while along the b axis σ1(ω) slowly recovers the spectral weight, removed for energies below 1000 cm-1 at T < Ts,N and p ~0.8 bar (Fig. 2.19(i,l)). At frequencies of about 4000 cm-1, the SW overshoot along the a axis substantially vanishes and the SW along the b axis merges towards a constant value for all p and T (Fig. 2.19(n,o)). The reshuffling of spectral weight thus occurs between the free-carriers contribution and the excitations in the FIR - MIR ranges, as a consequence of the SDW order. Along both axes and for ωc ≥ 10000 cm-1 (Fig. 2.19(q,r)) there is a full recovery of SW at any T and uniaxial pressure, so that the integrated SW converges to its value at 160 K for the equivalent experimental conditions, in agreement with the f-sum rule expectation. The SW, achieved for any ωc ≥ 10000 cm-1, is constant at all T and for any p, and is identical among both axes, thus establishing ω ~1 eV as a characteristic energy scale of the iron-pnictides, above which the optical response is fully isotropic as well as T-independent. Therefore, our SW analysis equally suggests the presence of correlation mechanism predominantly due to Hund's coupling.